
1. Applicable users and decision questions
This article is aimed at site managers, technicians and equipment maintenance staff at commercial fish farms, recirculating aquaculture systems, fry hatcheries and pond farms. Portable multi-parameter water quality pens (such as AtomBit Water Detective 4) are commonly used on site to quickly record turbidity, TDS, conductivity, temperature and other indicators for routine inspections and troubleshooting. But at real ponds, two confusions often arise: first, sensor readings are noticeably higher or lower than visual judgment; second, readings change after cleaning, leaving people unsure whether the suspended solids really changed or the sensor was simply dirty.
This article therefore focuses on three specific decision questions:
- When can a portable turbidity screening value be trusted for adjusting water exchange, aeration, feeding or suspending intake?
- How should maintenance and verification procedures be designed to avoid mistaking optical window contamination, bubbles or temperature drift for increased suspended solids?
- Under what circumstances must the measurement be repeated, the sensor taken out of service, or a sample be sent to a laboratory for confirmation analysis such as total suspended solids (TSS)?
It must first be made clear that a turbidity sensor measures the loss of water clarity caused by particles scattering/absorbing light, usually expressed in NTU or FNU; it is not equivalent to laboratory gravimetric total suspended solids (TSS, mg/L). Portable turbidimeters are used for screening, comparison and trend observation; they cannot replace laboratory analysis, nor can they prove that aquaculture water quality is safe or compliant.
2. Water samples, equipment, and scenario boundaries
2.1 device boundaries
Portable optical turbidity sensors are usually based on the 90° scattering or transmission-scattering principle and are suitable for an approximate range of 0–1000 NTU, but the linear range, repeatability and temperature compensation capability vary greatly between brands and models. This article discusses general optical-window portable turbidity pens/multi-parameter pens; actual maintenance intervals and calibration methods must follow the manufacturer's manual.
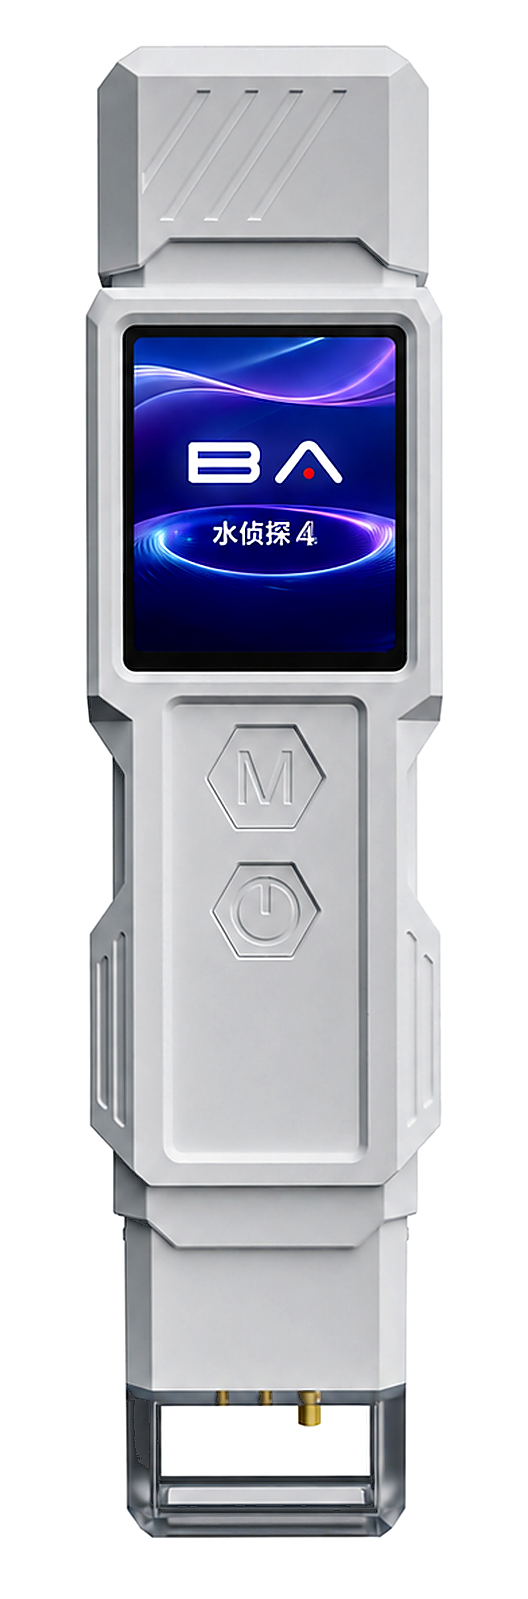
The Water Detective 4 integrates turbidity, TOC, COD, UV254, TDS, EC, salinity, hardness and temperature into a single handheld platform, positioned for personal/household use, field service and aquaculture screening. In aquaculture settings, it can quickly compare turbidity and conductivity changes at different times and depths in the same pond, but it is not suitable as a substitute for TSS filtration and weighing, chlorophyll a measurement or algal counts.
2.2 water sample boundaries
Turbidity ranges commonly seen in commercial fish-farming water samples are very wide:
- Recirculating water workshop: may be <5 NTU, in which case the cleanliness of the optical window is extremely demanding; a small fingerprint or micro-bubble will cause a noticeable error;
- Open-air ponds: affected by wind and waves, feeding, and sediment resuspension, may fluctuate from 20 NTU to hundreds of NTU;
- High-color water bodies (humic acid, tea-colored water) will interfere with low-range turbidity measurement; an instrument suitable for color compensation should be selected, or the color effect should be recorded.
2.3 Scenario boundaries
The following scenarios are not suitable for relying solely on portable turbidity screening:
- for compliance reports such as environmental discharge, aquaculture permits, or green certification;
- when specific contaminants are suspected (such as heavy metals, pesticides, pathogens, ammonia nitrogen, nitrite, dissolved oxygen), turbidity cannot indicate them;
- when quantitative TSS, VSS, particle size distribution, or algal species are required;
- when sensor readings are abnormal but cannot be restored by cleaning and calibration.
3. Reproducible sampling and measurement procedure
3.1 Sampling containers and sampling points
- Use clean, dark or opaque polyethylene/glass bottles to avoid photochemical reactions and continued algal growth. Rinse with source water 3 times before sampling.
- Fix the sampling points and depth: for example, set 2 points per pond (near the inlet and at the pond center), and each time sample at 1 m from the shore and 30 cm below the water surface; if bottom resuspension is of concern, an additional bottom sample may be added, but it must be recorded separately.
- Avoid sampling within 1 hours after baiting, medication, or strong wind mixing, unless your purpose is precisely to assess these disturbances.
3.2 Sample transport and storage
- After sampling, measure on site within 15 minutes if possible, and no longer than 2 hours (refer to USGS requirements for turbidity samples for details). If transport is needed, refrigerate but do not freeze, and avoid light and strong vibration.
- Record metadata such as sampling time, water temperature, weather, wind speed, and feeding time; otherwise the turbidity values cannot be interpreted.
3.3 On-site measurement sequence
- Before powering on, check the sensor optical window: no scratches, no water stains, no biofilm. If there is contamination, gently wipe with a soft cloth moistened with deionized water or a dedicated cotton swab.
- If the instrument has a temperature probe, immerse it together with the turbidity probe in the water sample and wait at least 30 seconds to 1 minutes for temperature equilibration.
- Slowly invert the sample bottle 3–5 times to homogenize suspended solids; do not shake vigorously, which generates bubbles.
- Immerse the sensor 2–3 cm below the liquid surface, avoiding contact with the bottle wall and bottom; keep the instrument still and record the first value after the reading stabilizes.
- Remove the sensor, rinse the optical window with deionized water, immerse it again in the same water sample, and record the second value. If the difference between the two readings exceeds the repeatability limit stated in the product instructions (for example ±5% or ±0.5 NTU, subject to the manufacturer), this indicates bubbles, contamination, or insufficient mixing, and remeasurement is required.
- Immediately after measurement, rinse the probe with deionized water and let it air dry or store it according to the manual.
3.4 Suspended solids check (on-site comparison)
To understand the relationship between optical turbidity and suspended solids, perform a "turbidity—TSS" comparison at least once per quarter or per culture cycle:
- Take a water sample from the same point and divide it into two portions: send one to the laboratory for TSS measurement (gravimetric method), and measure turbidity on site with the other.
- If necessary, perform 1:1, 1:3 dilution on the same water sample to establish the linear relationship between the on-site instrument reading and the diluted reading, and determine whether the reading exceeds the linear range.
- Use Secchi disk transparency as an auxiliary sensory indicator: transparency and turbidity usually show an inverse trend, but they are not completely physically equivalent and can only be used for trend judgment.
4. How to interpret results and common interferences
Possible causes of elevated turbidity in 4.1
In aquaculture water, elevated turbidity is usually caused by the following suspended particles:
- Clay or fine sediment: heavy rain, wind and waves, bottom fish stirring up sediment, sand-containing intake water;
- Mass proliferation of phytoplankton: water color turns green, yellow-green, or brown-green;
- Feed residue and fish feces debris: overfeeding or insufficient water exchange;
- Biofloc or bacterial flocs: recirculating water or biofloc systems.
Different causes require different management actions. Turbidity alone cannot distinguish them; comprehensive judgment is needed by combining water color, microscopic observation, TDS/conductivity, temperature, UV254/TOC and other screening parameters. For example, if turbidity rises while TOC/COD screening values also increase, it may indicate an increase in organic matter; if TDS/conductivity changes little while turbidity rises significantly, it may be inorganic sediment or phytoplankton.
4.2 Common interferences and failure modes
- Air bubbles: microbubbles adhering to the optical window or in the water scatter light and cause high readings. Letting the sample stand for a while after sampling, gently tapping the container, or using the manufacturer-recommended bubble guard can reduce this.
- Optical window contamination: biofilm, scale, fingerprints and dried water spots cause stable, elevated readings. A drop in the reading after cleaning indicates a maintenance issue.
- High-color water: dissolved colored substances such as humic acid and tannins absorb light, causing turbidity readings to be low or high depending on the optical design. If a water sample still has color after filtration, record the color effect; do not treat it directly as suspended solids.
- Temperature changes: a large temperature difference between the sample and the air can cause condensation; electronic components drift at zero under extreme temperatures. Before measurement, let the instrument and the sample equilibrate in the same environment.
- Settling: large particles settle quickly, and leaving the sample standing too long causes low readings; mix gently and measure immediately.
- Expired standard solutions: turbidity standards (formazin or polymer microspheres) are easily contaminated and degrade after opening, and calibration with expired standards introduces systematic error.
- Sensor aging: LED light source decay, photodetector drift and scratches on the window coating show up as inaccurate readings even after cleaning and require factory verification.
5. When to retest, stop use, or refer to a laboratory
5.1 Signals for timely re-measurement
- The relative deviation between two parallel measurements exceeds the repeatability stated by the manufacturer;
- The reading exceeds the daily recorded range by 2 times and there is no explanation such as heavy rain, feeding or agitation;
- It contradicts the direction of change in the Secchi disk: for example, turbidity decreases but transparency also decreases;
- Readings remain unstable after cleaning and calibration, fluctuating by more than ±10% (refer to the manual limits for specifics).
If the above occurs, immediately rinse the window with deionized water, recalibrate the low point and high point, and then measure the same water sample 3 times. If it returns to stable, continue using it; if it is still abnormal, proceed to the next level of troubleshooting.
5.2 Conditions for stopping use and sending for repair/replacement
- Obvious scratches, cracks or coating peeling on the optical window;
- Aging of the waterproof sealing ring or water ingress causing abnormal display;
- After cleaning and calibration, the zero point or span point cannot pass quality control (for example, the reading of 0 NTU standard solution is not 0 and cannot be adjusted);
- Readings still fluctuate irregularly after replacing with a new battery;
- The instrument has exceeded the manufacturer's recommended calibration interval or service life, and original factory calibration cannot be obtained.
5.3 Situations requiring referral to a laboratory for confirmation
- When declaration or verification is required for aquaculture tailwater compliance, green aquaculture certification, or export compliance;
- When risks such as algal toxins, pathogens, specific heavy metals, pesticides, ammonia nitrogen, nitrite, or dissolved oxygen are suspected, portable turbidity screening cannot provide evidence;
- When quantitative suspended solids TSS, volatile suspended solids VSS, particle size distribution, or algae counting is required;
- When on-site turbidity rises abnormally, accompanied by fish gasping at the surface, death, or reduced feeding, and combined pathogen and environmental diagnosis is required.
Laboratory analysis should be performed according to locally recognized methods, for example, TSS using the 103–105 °C oven drying gravimetric method (standard method 2540D), and turbidity using a benchtop turbidimeter compliant with ISO 7027 or EPA method 180.1. Specific method numbers and limits should be consulted with the local environmental or fisheries authorities.
6. Record sheet and action checklist
6.1 Daily/Weekly Site Record Sheet
The table below gives a minimal field set, which can be expanded according to the actual situation of the farm with pond number, area, feeding amount, etc.
| Date and time | Pond No./Point | Water temperature (°C) | Turbidity reading 1 (NTU) | Turbidity reading 2 (NTU) | Secchi depth (cm) | Cleaning/Calibration status | Operator | Remarks |
|---|---|---|---|---|---|---|---|---|
| 2025-06-10 08:30 | Pond A - Center | 27.8 | 35.2 | 34.9 | 40 | Window clean, zero point passed | Zhang San | After last night's feeding 12 h |
The table is for illustration only; refer to the manual for the reading interval and repeatability limits of different instruments.
6.2 Action Checklist
- Before each use: inspect the optical window and clean it after wetting with deionized water; check the battery.
- Weekly: perform a two-point check with 0 NTU and a standard solution close to the turbidity of the daily water sample, and record the deviation.
- Monthly: clean the probe sheath and inspect the O-ring; replace it if cracks or deformation are found.
- Quarterly or each culture cycle: compare with laboratory TSS at least once; also record Secchi depth and water color.
- Every six months or as recommended by the manufacturer: send to the original manufacturer or a third-party metrology institution for light source intensity and zero/span calibration.
- When an abnormality is found: clean first → calibrate → re-measure; if it cannot be restored, stop using it and send it to the laboratory.
7. FAQ
Q1: Why does the turbidity value drift when the same water sample is measured twice in a row? A: The most common causes are microbubbles, particle settling or contamination of the optical window. Re-mix according to Section 3 and measure immediately, and check whether the window is clean; if drift persists, it may be sensor zero drift, requiring a low-point calibration.
Q2: Can purified water or distilled water be used as the 0 NTU standard to calibrate a turbidity sensor? A: You must use the 0 NTU turbidity standard solution specified by the manufacturer or verified 0.2 μm filtered water. Ordinary purified water may contain tiny bubbles or dissolved gases, which will introduce a positive deviation after calibration.
Q3: Can a portable turbidity sensor replace a Secchi disk? A: It cannot fully replace it, but the two can complement each other. The Secchi disk is a sensory indicator of overall transparency and is affected by water depth, light and the observer; turbidity is an optical instrument indicator that is easy to record and compare trends with. Both should be recorded at the same time and used to verify each other.
Q4: Can the turbidity readings of the Water Detective 4 be used as proof of aquaculture water quality compliance? A: No. The turbidity, TOC, COD, UV254, TDS, salinity, hardness and other indicators of the Water Detective 4 and similar portable multi-parameter pens are intended for on-site screening and trend observation, not as certified-grade analytical instruments. In any situation requiring compliance or health and safety conclusions, testing must be carried out by a qualified laboratory using standard methods.
Q5: How often should laboratory suspended solids comparison be performed? A: It is recommended at least once per quarter or once per aquaculture cycle; if the pond water source, feed type or stocking density changes significantly, the comparison should be performed more often. When comparing, record the on-site turbidity, laboratory TSS, water temperature and sampling time of the same water sample.
References and Regional Applicability
- U.S. Geological Survey. (2018). Turbidity and Water. USGS Water Science School. https://www.usgs.gov/special-topics/water-science-school/science/turbidity-and-water (explains that turbidity is a measure of water clarity; high turbidity reduces light penetration and affects aquatic organisms.)
- World Health Organization. (2017). Guidelines for drinking-water quality: fourth edition incorporating the first addendum. Geneva: World Health Organization. https://www.who.int/publications/i/item/9789241549950 (emphasizes that turbidity is an aesthetic water-quality indicator that must be controlled to ensure treatment effectiveness, but it is not a direct health indicator.)
- Boyd, C. E., & Tucker, C. S. (1998). Pond Aquaculture Water Quality Management. Boston, MA: Kluwer Academic Publishers. (The management relationship among turbidity, suspended solids and transparency in pond aquaculture.)
Regional applicability note: The maintenance and verification methods given in this article are general, but aquaculture effluent discharge limits, TSS testing methods and instrument calibration specifications may differ between countries/regions. Where compliance judgments are involved, please refer to the latest requirements issued by the local fisheries, environmental protection or public health authorities; for specific product ranges, accuracy, calibration intervals and warranty conditions, refer to the latest AtomBit product manual.