
Intended users and decision questions
This article is aimed at operators of commercial recirculating aquaculture systems (RAS), aquaculture technicians, equipment maintenance personnel, and technical service providers who offer on-site rapid testing services to aquaculture farms. The typical scenario is: the system uses mechanical filtration, biological filtration, or combined filtration units, and it is necessary to quickly determine whether the filtration units are operating normally, whether water quality is within the expected trend, and when maintenance, retesting, or laboratory confirmation is needed.
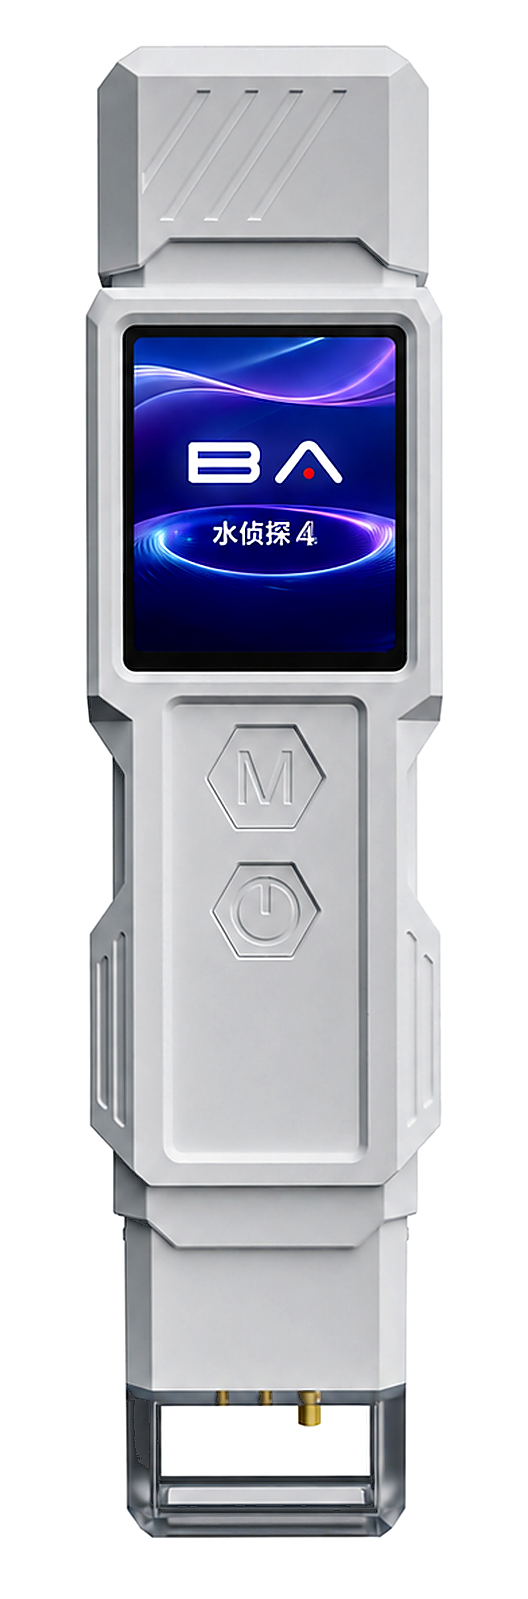
The Water Detective 4 portable water quality testing pen can measure TOC, COD, UV254, turbidity, TDS, conductivity, salinity, hardness, and temperature on a single rapid testing platform, making it suitable for on-site screening and trend comparison. However, it must be made clear that these parameters are screening/comparison/trend observation indicators and cannot replace laboratory identification of specific contaminants. In particular, for ammonia nitrogen, nitrite, nitrate, dissolved oxygen, bacteria, viruses, parasites, and other items critical in recirculating aquaculture, the Water Detective 4 does not have detection capability, and locally recognized laboratory methods or dedicated sensors must be used.
On this premise, the core decision questions this article addresses include:
- Which sampling points should be set up before and after filtration?
- How can the same portable instrument be used to obtain repeatable paired data?
- Within what range can the changes in each indicator before and after filtration be considered "normal"?
- When an anomaly occurs, should one retest, shut down for maintenance, or immediately refer the sample to the laboratory?
- How can a record sheet be established that can be used for daily management and traceability?
The answers to these questions cannot be separated from the specific cultured species, system design, and local water quality benchmarks. This article only provides a methodological framework and operational logic; specific thresholds must be determined in conjunction with aquaculture manuals, equipment specifications, and local regulatory requirements.
Water sample/device/scenario boundaries
Applicable scenarios
This article applies to recirculating water treatment systems in commercial fish farming and aquaculture, especially in the following situations:
- The system is in steady-state operation, and periodic screening is intended to detect declining filtration efficiency or sudden water quality changes;
- After a filtration unit is newly installed or modified, the difference before and after filtration needs to be quickly verified;
- On-site conditions do not allow immediate laboratory submission, but a preliminary assessment and record are needed first;
- Service personnel use portable instruments to provide customers with quick comparisons that support maintenance recommendations.
Not applicable in the following situations:
- A compliance certificate or quarantine report needs to be issued;
- Fish show abnormal mortality or obvious stress and pathogens or toxins need to be diagnosed immediately;
- Key aquaculture parameters such as ammonia nitrogen, nitrite and dissolved oxygen need to be accurately measured;
- The nitrification/denitrification efficiency of a biological filter needs to be evaluated (this requires dedicated electrochemical or colorimetric methods).
Device boundaries
Among the nine indicators of Water Detective 4:
- TOC, COD, UV254 and turbidity are used for screening organic load and particulate matter;
- TDS, conductivity, salinity and hardness are used for screening dissolved substances and ionic strength;
- temperature is used to correct readings and assess the thermal load on the equipment.
Before use, you must check the measuring range, accuracy, temperature compensation range, calibration method and applicable water sample types (such as freshwater/seawater) in the product specification sheet to ensure that the water sample to be tested falls within the instrument's reliable range. The database does not provide specific values, so this article does not cite any unconfirmed range or accuracy data.
Pay particular attention to the following:
- high-salinity or high-hardness water samples may exceed the linear range of certain optical or conductivity channels;
- water samples containing large amounts of bubbles, algae or flocs will interfere with optical measurements;
- temperature changes directly affect conductivity and TDS readings, so you must wait for temperature equilibration or use the instrument's temperature compensation function (if available).
Regional and regulatory boundaries
Different regions have different regulations for aquaculture water, discharge water and product safety. The general background materials cited in this article (such as the WHO drinking water guidelines and the SRAC recirculating water management publication) are used only to explain the meaning of parameters and general management principles, and do not constitute limit recommendations for any specific aquaculture scenario. Actual warning thresholds and compliance limits must be provided by the local aquaculture authority or a certified laboratory.
Reproducible sampling and measurement steps
Sampling point design principles
In a recirculating water system, "before filtration" and "after filtration" must be set up as a pair so that the contribution of the filtration unit can be determined from the difference. The recommended sampling points are as follows:
| No. | Location | Description |
|---|---|---|
| A | Filtration unit inlet (after pump, pipe or collection tank) | Represents the water to be treated; should be as close as possible to the filtration unit, avoiding bypass or mixing |
| B | Filtration unit outlet (return pipe or clean water tank) | Represents the treated water; should be as close as possible to the filtration unit, avoiding mixing with untreated water |
| C (optional) | System main return point (aquaculture tank inlet) | Used to observe overall system water quality, but affected by contamination and mixing within the tank |
For multi-stage filtration, sampling points may be set before and after each stage, but at minimum should cover the inlet and outlet of the first-stage mechanical filtration and the last-stage biological filtration. All sampling points should be at fixed positions and clearly marked on the piping to ensure consistent sampling locations each time.
Sampling containers and operating procedures
- Use a clean, residue-free sampling bottle (PET or glass is recommended; avoid containers that contain plasticizers or cleaning agent residue).
- Before sampling, rinse the container 2–3 times with the water sample to be tested.
- When sampling, avoid disturbing sediment at the bottom or drawing in surface scum; slowly immerse the container in the water, and cap it once the water sample has settled.
- If the water sample contains obvious bubbles, let it stand for several minutes until the bubbles dissipate, or gently tap the container wall.
- Record the sampling time, water temperature, system flow rate, and recent maintenance operations (such as backwashing, chemical dosing, or water replacement).
Measurement sequence using the Water Detective 4
It is recommended to measure in the following order to reduce cross-interference:
- Power on the instrument and confirm that it has completed self-check and is within its calibration validity period (refer to the product manual).
- Rinse the probe with deionized water or purified water, then rinse it 1–2 times with the water sample to be tested.
- Fully immerse the probe in the pre-filtration water sample (Point A), and gently swirl it to remove bubbles from the probe surface.
- Wait for the reading to stabilize (refer to the product manual for the specific stabilization time, usually tens of seconds).
- Record temperature, turbidity, TOC, COD, UV254, TDS, conductivity, salinity, and hardness in sequence.
- Remove the probe, rinse it with deionized water, and wipe it dry.
- Repeat steps 2–5 for the filtered water sample (Point B).
- Repeat the measurement at least 2 times at each sampling point and take the average; if the difference between two readings exceeds the instrument's repeatability tolerance, clean the probe again and take a third measurement.
Key points for reducing errors
- All water samples should be measured in the same temperature environment, avoiding direct sunlight or strong wind.
- Use the same instrument, the same calibration batch, and the same operator to reduce systematic errors.
- Clean the probe with deionized water before and after each measurement to prevent salt crystallization or organic matter adhesion.
- Record the instrument's serial number, firmware version (if readable), and the most recent calibration date.
How to interpret results and common interferences
Expected changes in each parameter before and after filtration
| Indicator | Mechanical filtration (sedimentation, sand filtration, microfiltration) | Biological filtration | Chemical filtration (activated carbon, protein skimmer) | Remarks |
|---|---|---|---|---|
| Turbidity | Significant decrease | Generally not significant | may decrease | Is the most intuitive parameter for evaluating mechanical filtration efficiency |
| TOC / COD / UV254 | Partial decrease (removes particulate organic matter) | Limited effect; mainly degrades dissolved readily biodegradable organic matter | Can decrease significantly (adsorption or oxidation) | High background values may mask small changes |
| TDS / conductivity / salinity / hardness | Essentially unchanged | Essentially unchanged | Usually unchanged | Unless there is ion exchange, reverse osmosis, or addition of salts |
| Temperature | May rise slightly (pump heat) | Essentially unchanged | May change slightly | Ambient temperature and system settings should be recorded |
The above changes are only general trends; actual results depend on filter type, load, flow rate and maintenance status. The most important thing is to establish a historical baseline for this system and obtain the normal variation range through multiple measurements, rather than relying on a single absolute value.
Common interferences and failure modes
- Bubble interference : Microbubbles in the water sample will significantly increase turbidity and readings of optical indicators. Letting the sample stand after collection and gently tapping the container can reduce the impact.
- Probe contamination : High-concentration water sample residue from the previous measurement will contaminate subsequent low-concentration water samples, causing readings to be too high or too low. Be sure to clean thoroughly.
- Temperature not equilibrated : Conductivity changes with temperature; failing to wait for temperature equilibration or not enabling compensation will cause deviations in TDS/conductivity readings.
- Stagnant water at sampling point : Stagnant water may form near pipe elbows and valves and cannot represent the main fluid. A portion of water should be drained before sampling.
- Biofilm detachment : Filter backwashing or water flow impact will cause biofilm fragments to enter the water sample, causing a transient increase in turbidity and TOC. Sampling should be performed during stable operation.
- Light interference : The optical measurement channel is sensitive to stray light; avoid measuring under direct strong light and ensure the probe's light shield is intact.
- Salinity out of range : High-salinity water samples may saturate certain optical channels or cause conductivity to exceed the range; the instrument's applicability must be confirmed.
The correct way to interpret results
- Focus on the difference before and after filtration (point B minus point A) and how that difference changes over time, rather than looking at the post-filtration absolute value in isolation.
- If the decrease in turbidity after filtration becomes significantly smaller, even if the post-filtration turbidity still "looks not bad", it may indicate a decline in mechanical filtration efficiency.
- TOC, COD, and UV254 usually have high background values in aquaculture water, and small changes may be masked by background fluctuations; in this case, turbidity changes should be considered together for a comprehensive judgment.
- Any single anomaly should be re-tested for confirmation after eliminating interfering factors, and the system operation records should be checked (e.g., whether feeding has just occurred, whether water has been changed, whether backwashing has been performed).
When to retest, stop using, or send to a laboratory
Conditions for triggering a re-test
If any of the following situations occurs, the same method should immediately be used to re-test the same sampling point once:
- Turbidity after filtration has not decreased or is even higher than before filtration;
- TOC, COD, and UV254 show a sudden change exceeding the historical normal fluctuation range;
- TDS, conductivity, and salinity show unexpected sudden changes (excluding known causes such as salt addition and evaporative concentration);
- Temperature deviates from the system setpoint by more than ±2°C;
- Instrument readings fluctuate abnormally or an error is reported.
During re-testing, first check probe cleanliness, bubbles, and temperature equilibration, and re-sample. If the re-test result returns to normal, record it as an occasional interference; if the re-test result remains abnormal, proceed to the next level of judgment.
Conditions for stopping reliance on screening data
If two consecutive anomalies occur, or any of the following situations occurs, stop using Water Detective 4 as the primary basis for judgment and immediately switch to laboratory testing:
- abnormal behavior, reduced feeding, floating at the surface, or death in farmed animals;
- suspected exceedance of key parameters such as ammonia nitrogen, nitrite, or dissolved oxygen;
- need to determine whether the biological filter has crashed;
- abnormal water sample color or odor, or discovery of large amounts of foam or dead algae;
- the system has just undergone medication treatment, disinfection, or a large water change, and residues or shock need to be assessed.
In these cases, water samples must be collected and sent to a qualified local laboratory. The tests should at minimum include: ammonia nitrogen (NH₃-N), nitrite (NO₂⁻-N), nitrate (NO₃⁻-N), dissolved oxygen (DO), pH, alkalinity, and temperature; when necessary, add total bacterial count, specific pathogens, or heavy metals. Laboratory methods and limits shall be governed by local authority regulations.
Sampling requirements for referral to a laboratory
- Use sterile or dedicated sampling bottles provided by the laboratory, and add preservatives according to the laboratory's instructions (for example, samples for ammonia nitrogen and nitrite usually need to be refrigerated and submitted as soon as possible).
- Record the sampling time, water temperature, pH (if available), system status, and the performance of the farmed animals.
- At the same time, use Water Detective 4 to measure a parallel water sample and record the results, so that they can later be compared with the laboratory results and a correspondence can be established between the instrument and the laboratory method.
- If a specific pathogen is suspected, tissues, blood, or water samples must be collected according to veterinarian or laboratory requirements; do not rely solely on water quality screening.
记录表/行动清单
Daily screening record table template
| Date | Time | Sampling point | Water temperature (°C) | Turbidity (NTU) | TOC (ppm) | COD (ppm) | UV254 | TDS (ppm) | EC (µS/cm) | Salinity (ppt) | Hardness (ppm) | Operator | Remarks | | --- | --- | --- | --- | --- | --- | --- | --- | --- | --- | --- | --- | --- | --- | | 2025-01-01 | 09:00 | A (before filtration) | 25.3 | 12.4 | 8.2 | 15 | 0.145 | 620 | 1240 | 0.3 | 180 | Zhang San | 1h after normal feeding | | 2025-01-01 | 09:05 | B (after filtration) | 25.5 | 3.1 | 6.0 | 10 | 0.098 | 615 | 1230 | 0.3 | 178 | Zhang San | No abnormalities |
(Note: The values in the table are format examples only and do not represent any actual measurement results or limits.)
Weekly/Monthly Maintenance Action Checklist
- [ ] Perform paired before/after filtration measurements at least once a week, record the differences and plot trend charts.
- [ ] Clean the probe monthly with deionized water, and perform calibration or performance verification as required by the product manual.
- [ ] Every quarter or half year, send the same water sample to a laboratory for testing of key indicators, compare with the portable instrument readings, and evaluate instrument drift.
- [ ] Establish a "normal difference range" for this system, such as the percentage decrease in turbidity before and after filtration and the percentage decrease in TOC, and set warning thresholds.
- [ ] When the decrease in turbidity before and after filtration is lower than the normal range by 80%, schedule filter media cleaning or replacement.
- [ ] When TDS/EC shows a sudden change of more than ±30% that cannot be explained by salt addition or evaporation, check the equipment or the water source.
- [ ] All abnormal readings, maintenance operations and laboratory reports should be archived for at least one farming cycle.
Action Decision Quick Reference
- Single abnormal reading → clean the probe, resample, retest → normal → record the cause of interference.
- If the retest is still abnormal → check whether the system is backwashing, dosing, or changing water → compare with historical data → if it is part of planned operations, continue to observe; if it cannot be explained → consider sending a sample to the laboratory.
- Two consecutive abnormal results or abnormal animals → immediately stop relying on screening, collect laboratory samples, and at the same time troubleshoot equipment faults.
- Under no circumstances should portable instrument readings be used as proof of product safety or compliance.
FAQ
Q: Can the Water Detective 4 measure ammonia nitrogen or nitrite? A: No. The TOC, COD, UV254, turbidity, TDS, conductivity, salinity, hardness and temperature measured by the Water Detective 4 do not include ammonia nitrogen, nitrite, nitrate or dissolved oxygen. These indicators require dedicated laboratory methods or electrochemical sensors.
Q: Is it normal for TDS to remain completely unchanged before and after filtration? A: Usually yes. Mechanical filtration and biological filtration generally do not significantly change total dissolved solids. If TDS changes noticeably, consider whether salt has been added or whether reverse osmosis, ion exchange or a change of water source has occurred.
Q: How often should the instrument be calibrated? A: Please refer to the product manual. In general, regular calibration or comparison with laboratory methods is recommended; especially after use in high-load or high-salinity environments, the instrument should be cleaned and checked.
Q: Can it be used in seawater aquaculture systems? A: It is necessary to check whether the salinity and conductivity ranges of the Water Detective 4 cover the seawater range. High salinity may affect some optical measurements; it is recommended to consult AtomBit technical support first and verify suitability.
Q: Can the measurement results be used to determine whether fish are healthy? A: No. Water quality screening can only provide indirect trends; fish health is also affected by pathogens, feed, management and many other factors. Any health conclusion requires veterinary diagnosis.
References
- WHO. (2017). Guidelines for Drinking-water Quality, 4th edition, incorporating the first addendum. Geneva: World Health Organization. Available online: https://www.who.int/publications/i/item/9789241549950 (used for background explanation of the general meaning of parameters such as TDS and hardness; does not constitute aquaculture limits)
- Masser, M. P., Rakocy, J., & Losordo, T. M. (1999). Recirculating Aquaculture Tank Production Systems: Management of Recirculating Systems. SRAC Publication No. 452. Southern Regional Aquaculture Center. (used for general principles of water quality management in recirculating systems)
- Timmons, M. B., & Ebeling, J. M. (2013). Recirculating Aquaculture, 3rd Edition. Ithaca Publishing. (used for background on recirculating aquaculture system design and water quality monitoring)
The above sources only provide a general knowledge framework; specific water quality limits, monitoring frequency and compliance requirements must be confirmed with local aquaculture authorities, university extension services or accredited laboratories.
Regional applicability statement
Different countries and regions vary widely in their requirements for aquaculture water quality, discharge water and product safety. The sampling and measurement methods provided in this article are generally applicable, but any warning thresholds, action trigger conditions or "normal ranges" must be localized and adjusted according to local regulations, cultured species and system design. When using the Water Detective 4 for on-site screening, readings must not be directly equated with compliance testing results. For key indicators such as ammonia nitrogen, nitrite, dissolved oxygen and pathogens, confirmation must be obtained using appropriate laboratory or dedicated methods in accordance with local requirements.