
Embedding water quality detection in smart water appliances is expanding from water purifiers and water dispensers to coffee machines, smart water bottles and pet water fountains. For product teams, the biggest challenge is often not "can it measure" but "how to achieve sufficiently useful refresh at the lowest power consumption". This article is aimed at brands, product managers, embedded engineers and OEM customers. It discusses power consumption and refresh strategies based on the AtomBit conductivity/TDS interface ASIC, with emphasis on design choices, implementation paths and boundaries.
1. Why power consumption and refresh strategy need separate design
TDS/conductivity measurement itself is a short-duration, low-frequency physical measurement. In typical home appliances, water quality changes slowly, so there is no need for continuous high-speed sampling. Instead, the system should be in low-power standby most of the time, waking up, sampling, processing and communicating only when needed. The allocation of the power budget directly affects the battery life design, power device selection and thermal management of battery-powered products.
From a system perspective, power consumption consists of the following parts:
- Standby: the MCU and sensor interface chip enter sleep, retaining RTC or external interrupt.
- Wake-up: triggered by a timer, flow switch, door sensor, button or heating state change.
- Sampling: the chip executes one measurement cycle, exciting the probe and collecting data.
- Display: refresh LCD/LED only when the value changes or the user checks it.
- Communication: report data via UART, BLE or Wi-Fi.
- Heating linkage: water dispensers and coffee machines undergo large temperature changes during heating, so measurement timing needs to be coordinated.
2. Key devices and measurement characteristics
AtomBit offers a variety of conductivity/TDS sensor interface ASICs suitable for different space and integration requirements:
| Model | Key features | Application scenarios |
|---|---|---|
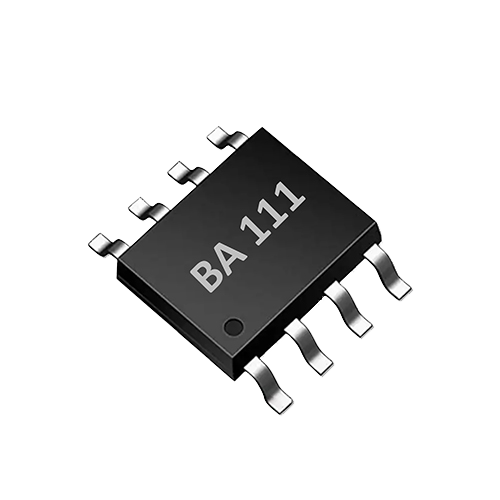
| BA111 | Single-channel TDS measurement, 0–3000 ppm, TDS temperature compensation, bipolar drive, UART control, few external components | General-purpose water purifiers, water dispensers, devices requiring simple integration |
| BA311 | SOT23-6 package, automatic 300 ms measurement cycle, 3–5 V wide voltage, BURST Tx output, bipolar drive | Space-constrained smart cups, pet water dispensers, small modules |
| BA234 | Single-channel dual-probe interface, automatic NTC temperature compensation, bipolar pulse excitation, UART 9600 bps | Devices that require NTC compensation, a dual-probe structure, or more precise temperature correction |
Bipolar drive is a common feature of these chips: by exciting with alternating polarity, probe polarization is reduced, thereby lowering long-term drift and maintenance frequency. The automatic 300 ms measurement cycle of the BA311 means the chip can complete a measurement on its own and output the result, without the MCU having to finely control the excitation timing, further simplifying the design of low-power state machines.
3. Dimensions of power consumption analysis
3.1 Standby and wake-up
When the system is in standby, the power supply to the sensor interface chip should be shut off as much as possible, or the chip should be put into a low-power mode. The BURST Tx output of the BA311 can send data immediately after a measurement ends, after which the chip returns to a low-power state. The MCU can use an RTC for timed wake-up, or be woken by an external interrupt (water flow sensor, button), to reduce average power consumption.
3.2 Sampling power consumption
The power consumption of a single sampling depends on the number and duration of excitation pulses, the probe impedance, and the operating voltage. The 300 ms automatic measurement cycle of the BA311 provides a clear time window, and designers can calculate the energy consumed by each measurement based on that window. However, it should be noted that actual power consumption also includes the chip peripherals, MCU wake-up, and ADC reading, etc., so it must be based on the datasheet and actual measurements; it cannot simply be estimated by multiplying the operating voltage by some fixed current.
3.3 Display and communication
The display refresh rate should be decoupled from the measurement frequency. Even if a measurement is taken once per minute, the display does not need to update every minute unless the value changes beyond a set threshold or the user actively checks it. The same applies to communication: for low-power wireless devices, a notification can be sent only when a TDS change exceeding a preset threshold is detected; otherwise, the device stays silent.
3.4 Heating interlock
In water dispensers and coffee machines, the water temperature rises rapidly while the heater is running, conductivity changes with temperature, and convection and bubbles can disturb the water near the probe. It is recommended to wait for the temperature to stabilize after heating ends before measuring, or to use the chip's built-in temperature compensation (TDS temperature correction on the BA111, automatic NTC compensation on the BA234) to correct for the temperature effect; however, the thermal response delay of the probe must still be taken into account. The ideal approach is to sample after a delay once the heating circuit is turned off, avoiding noise and temperature gradients during heating.
4. Refresh strategy design
Refresh strategies can be divided into three categories:
- Event-driven: take a measurement immediately when events such as the user drawing water, refilling water, replacing the filter, or power-on self-test occur.
- Periodic-driven: wake up at fixed intervals to measure, suitable for scenarios that require continuous trends.
- Hybrid mode: normally measure at a low-frequency period; when an event occurs, measure immediately and refresh the display, then return to low power consumption.
For battery-powered smart water bottles and pet water dispensers, it is recommended to use a longer period (such as several minutes to several tens of minutes) plus event triggering. The specific period needs to be determined based on the actual rate of water quality change, battery capacity and user tolerance; a fixed battery life commitment cannot be given.
A typical process is as follows:
- The device sleeps, waiting for the RTC countdown or an external interrupt.
- When the wake-up time is reached or an event is triggered, the MCU powers up and turns on the sensor power supply.
- The chip performs measurement (BA311 automatically 300 ms; BA111/BA234 are started by MCU control commands).
- The MCU reads TDS and temperature and performs filtering (taking the median or average of multiple samples).
- If the value change is greater than the threshold, update the display or report; otherwise, go directly to sleep.
- Turn off the sensor power supply, and the MCU enters low power consumption mode.
The following strategy examples can be referenced for different product forms:
- Water purifier/water dispenser: powered by mains electricity; it can measure once after each water draw or once every 30 minutes, measure with a delay after heating ends, and display the TDS value and filter trend.
- Coffee machine: measure once when the water tank is refilled; if TDS is abnormal before brewing, alert the user.
- Smart water bottle: measure after the user drinks, display TDS or water quality level, then sleep; when there are no events, perform low-frequency inspection.
- Pet water fountain: measure at scheduled intervals of every few hours; measure immediately when a pet is detected nearby (infrared or water flow).
5. Temperature compensation and data credibility
TDS/conductivity measurement must include temperature compensation; otherwise readings will drift at different water temperatures. BA111 has built-in TDS temperature correction, and BA234 provides automatic NTC temperature compensation, which can simplify external temperature handling. However, in heating equipment, the compensation algorithm can only correct the effect of temperature on conductivity and cannot eliminate errors caused by bubbles, convection and probe contamination. Therefore, heating-linked strategies are more important than relying solely on compensation.
6. Filter management and trend prompts
TDS data is often used for filter life prompts, for example, reminding the user to replace the filter when the TDS value continues to rise or exceeds a set threshold. It must be clear that this is device feedback and trend indication, not laboratory water quality analysis. The TDS value cannot reflect risks such as bacteria, viruses, organic matter or specific heavy metals, and whether a filter has failed also needs to be considered together with flow rate, time and laboratory testing. Absolute statements such as “water quality qualified” and “safe drinking water” should be avoided in product descriptions and UI.
7. Cost and mass-production validation
In OEM/ODM integration, cost and mass-production consistency are equally important. The interface chips provided by AtomBit require few peripheral circuits (such as BA111), which can reduce BOM cost and PCB area. The matching probes support customization of structure, wiring harness, interface and application calibration, helping complete-machine manufacturers quickly adapt to different water paths and installation positions.
Mass-production validation needs to focus on:
- Standard conductivity solution calibration: calibrate on the production line using a standard solution with a known TDS value to ensure batch consistency.
- Temperature compensation verification: test reading deviation at different water temperatures.
- Power consumption test: use a power analyzer to measure the current in each state—standby, wake-up, sampling, and communication—calculate average power consumption, and verify the refresh cycle design.
- Long-term drift: simulate long-term operation and check probe polarization and contamination.
8. Limitations and boundaries
- TDS/conductivity only reflects the total amount of dissolved solids and is a rough indicator of water quality; it cannot replace laboratory testing.
- The measurement accuracy of the chip and probe is affected by factors such as water temperature, flow rate, bubbles, and probe surface condition. Structural design must avoid dead-water zones and bubble accumulation.
- The actual effect of power optimization strategies depends on the specific hardware and software implementation. Different battery capacities, operating temperatures, and battery chemistries all affect battery life; this article does not provide fixed battery life data.
- More complex water quality parameters such as optical COD/TOC/UV254, if used in household devices, involve completely different power consumption, refresh, and optical window antifouling strategies; they require separate evaluation and are outside the scope of this article.
9. Implementation step checklist
- Confirm the product positioning: power supply method (mains/battery), measurement scenario, and user interaction requirements.
- Select the interface chip: choose BA311 for space-constrained designs; choose BA234 when NTC/dual probes are required; choose BA111 for basic TDS.
- Design the wake-up circuit: RTC timer, external interrupts (water flow, door sensor, button) or host wake-up command.
- Set the measurement timing: Arrange the sampling period and settling time according to the chip characteristics to avoid heating interference.
- Software filtering and thresholds: Use median filtering or a moving average, and set display/report thresholds to reduce invalid communication.
- power consumption verification: Measure the current in each state under real firmware, calculate the average power consumption, and iterate on the refresh period.
- Mass production calibration: Standard solution calibration, temperature testing, power consumption sampling and long-term aging verification.
10. FAQ
Q: Does the BA311's automatic 300 ms measurement cycle mean that each measurement only consumes 300 ms of power? A: 300 ms is the cycle in which the chip completes one measurement and outputs data, but the overall sampling power consumption of the system also includes the time for MCU wake-up, sensor power supply settling, data reading and so on. The actual energy consumption of a single sampling should be based on hardware measurements.
Q: Can real-time TDS monitoring be implemented in a battery-powered smart water bottle? A: Continuous real-time measurement is generally not recommended. A low-frequency periodic measurement plus event triggering (such as after the user drinks water) can provide useful information while significantly extending battery life.
Q: Can the TDS value directly determine whether the filter cartridge has failed? A: No. The TDS trend can serve as a reference signal for filter cartridge replacement, but the filter cartridge also involves indicators such as microorganisms and organic matter, which must rely on laboratory analysis. The product should be positioned as a trend indicator, not a safety certification.
Q: Will TDS measurement be inaccurate during heating? A: Temperature compensation can correct part of the temperature effect, but convection, bubbles and temperature gradients during heating will introduce additional errors. It is recommended to measure after a delay following the end of heating, or at least to wait for the water to stabilize after the heater is turned off.
Q: How can consistency among different devices in mass production be ensured? A: Use standard conductivity solutions for calibration, verify temperature compensation and the measurement range, and use AtomBit's OEM customization services (structure, wiring harness, interface and application calibration) for complete product adaptation.