
Introduction
Aquarium electrical conductivity (EC) and total dissolved solids (TDS) monitoring is becoming a common feature in smart aquarium products. But developers often encounter user feedback: "The value keeps changing — is there a problem with the water quality?" In reality, an aquarium is a dynamic ecosystem, and conductivity fluctuations can stem from many normal or abnormal factors. This article, from the perspective of sensor integration and user communication, sorts out common misconceptions to help product teams design more reliable monitoring logic and explanatory messaging.
Intended users and decision questions
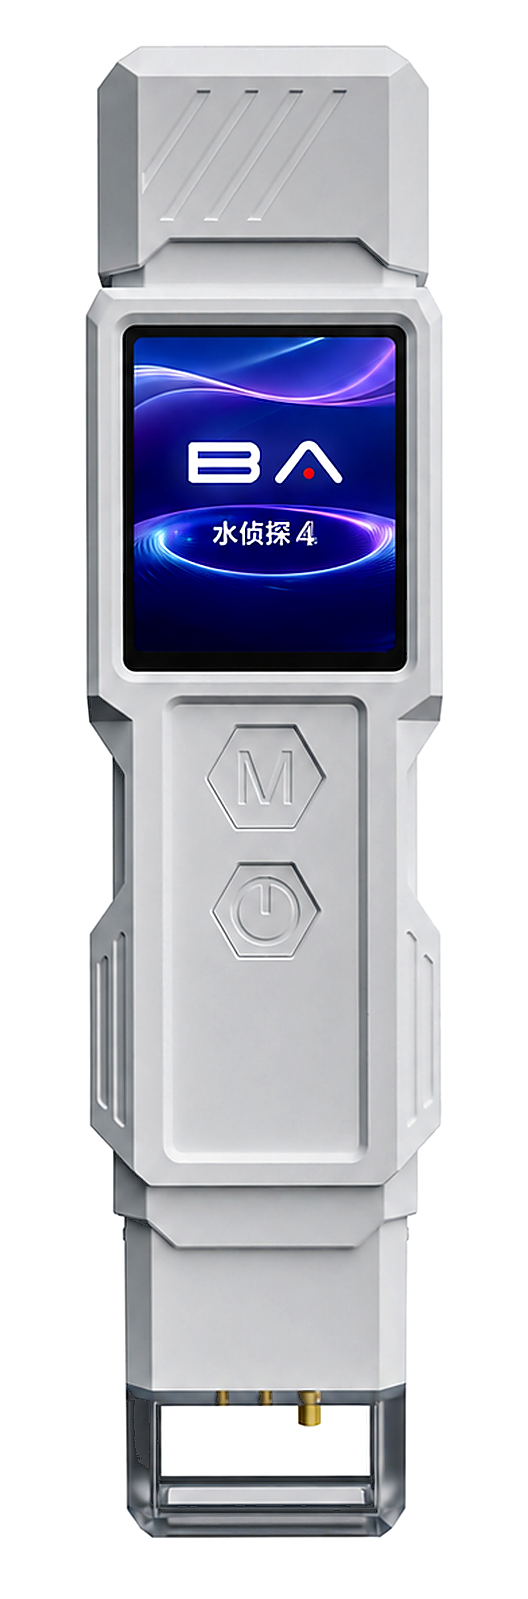
This article is intended for hardware engineers, product managers and embedded developers who are developing smart aquariums, aquarium monitoring modules and pet aquarium peripheral devices. Key decision questions include: how to set thresholds for conductivity fluctuations? How to distinguish normal fluctuations from abnormalities that require alerts? How to avoid false alarms caused by temperature, air bubbles and other factors? How to explain readings to end users to prevent panic or neglect? Meanwhile, portable multi-parameter water quality test pens (such as AtomBit Water Detective 4) can be used for on-site verification and comparative testing during the development phase.
Water sample/device/scenario boundaries
Water Detective 4 measures TOC, COD, UV254, TDS, EC, turbidity, hardness, salinity and temperature; it is a field screening tool suitable for rapid trend observation, comparison of different water samples and verification of device effectiveness. It cannot replace laboratory testing and cannot measure ammonia nitrogen, nitrite, nitrate, dissolved oxygen, heavy metals, bacteria, viruses or parasites. In aquarium scenarios, EC/TDS can only serve as an indirect indicator of overall water quality changes and cannot by itself determine "whether water quality is good or bad" or "whether fish can survive." It must be combined with temperature, turbidity, user behavior (water changes, additives) and fish condition.
Reproducible sampling and measurement steps
To obtain comparable data, the sampling method and time points should be kept consistent.
- Pre-sampling preparation: Rinse the container and probe three times with the water sample to be tested. Ensure the probe is clean, free of biofilm or salt scale. If the probe has a protective cap, remove it and inspect the electrode.
- Water sample collection: At a location away from the filter outlet and aeration bubbles, slowly collect the sample at a depth of 5-10 cm underwater, avoiding stirring up the bottom sediment. If using flow-through measurement, let the water sample stand for 30 seconds to eliminate air bubbles.
- Measurement: Turn on the test pen and wait for the reading to stabilize (usually 10-30 seconds; see the manual for details). Record temperature, EC and TDS. It is recommended to repeat the measurement 2-3 times and take the average; if the deviation exceeds 5%, check the probe or the uniformity of the water sample.
- Recording: Record the date, time, temperature, EC, TDS, user actions (such as water changes, feeding, salt addition) and fish condition in a dedicated table.
- Cleaning and storage: After measurement, rinse the probe with pure water or deionized water, shake dry and replace the protective cap. If the probe has stubborn dirt, wipe it with a soft cloth according to the manual; do not use organic solvents.
For embedded sensors, calibration must be performed before mass production: calibrate in a standard conductivity solution (such as 1413 µS/cm) and verify the temperature compensation coefficient. Remind users to clean the probe periodically (such as monthly), and set up probe contamination detection in the firmware (such as prompting maintenance when readings drift or response slows).
How to interpret results and common interferences
Possible sources of conductivity changes in an aquarium can be summarized as follows:
| Factor category | Specific source | Effect on EC/TDS | Common misconception |
|---|---|---|---|
| Physical factors | Evaporation and concentration | Water level drops, EC/TDS rises | Mistaken for worsened contamination |
| Physical factors | Temperature changes | Temperature rises, EC reading increases (when uncompensated) | Neglecting temperature compensation |
| User behavior | Water change (tap water or RO water) | Usually lowers EC/TDS (depending on water source) | Expect it to drop immediately after the water change to 0 |
| User behavior | Adding salt, mineral conditioners, medications | Significantly raises EC/TDS | Ignoring the effect of additives on readings |
| Biological factors | Fish metabolism, decomposition of leftover feed | Slowly raises TDS, EC may rise slightly | Assuming EC directly reflects ammonia nitrogen/nitrite |
| Equipment factors | Release from filter media (new filter media, activated carbon) | Initial TDS may rise | Panic that water quality is deteriorating |
| Measurement interference | Bubbles, probe contamination, electromagnetic interference | Readings fluctuating, high, or low | Assuming the sensor is faulty |
Detailed explanation of common misconceptions
Misconception 1: Rising conductivity equals deteriorating water quality. EC only indicates the total amount of dissolved ions and does not distinguish beneficial ions (such as calcium and magnesium) from harmful substances (such as ammonia nitrogen and nitrite). Adding mineral salts to an aquarium or evaporative concentration will both raise EC, but in the short term this may be harmless or even beneficial to fish. It must be judged together with other indicators (such as ammonia nitrogen and nitrite, which require laboratory testing) and the condition of the fish.
Misconception 2: TDS and EC can be converted directly, ignoring temperature compensation. TDS is usually estimated by multiplying EC by an empirical coefficient (0.5-0.7), but this coefficient varies with ion composition. For every 1°C increase in temperature, EC increases by about 2%, so temperature compensation is essential. If the sensor lacks temperature compensation or the compensation algorithm is improper, it will falsely report water quality changes.
Misconception 3: If device readings are inconsistent with laboratory results, the instrument is inaccurate. Laboratory methods measure specific substances (such as nitrate by ion chromatography), whereas TDS/EC is a total-amount indicator, and there is no direct linear correspondence between the two. In addition, sampling time, sample handling, and probe condition all affect readings.
Misconception 4: Aquarium conductivity should remain constant. In reality, normal evaporation, feeding, and water changes all cause small fluctuations. The device algorithm should set a reasonable fluctuation tolerance range to avoid frequent alarms.
Misconception 5: EC should not change after adding nitrifying bacteria or water conditioners. Many commercially available products contain salt carriers that temporarily raise EC/TDS. Evaluation should be performed 24-48 hours after addition.
When to retest, stop using, or send to a laboratory
Retesting or professional help is required in the following situations:
- Readings change suddenly and substantially (e.g., EC changes by more than 30%) with no clear user action.
- Fish show abnormal behavior (gasping at the surface, poor appetite, abnormal body surface, death).
- The user reports that water-quality readings remain abnormal after adding medication, salt or treatment agents.
- When a specific disease needs to be diagnosed or ammonia nitrogen, nitrite, nitrate, heavy metals or pathogens need to be assessed, laboratory methods must be used (such as colorimetry, ion chromatography, PCR, etc.), and local veterinary/aquaculture department guidance must be followed.
- If probe readings are unstable, calibration fails or an error code is displayed, stop using the device and contact the manufacturer for repair or replacement.
As a device developer, you should clearly state in the user interface: "This device is for trend monitoring only and cannot replace laboratory testing. If fish are abnormal, consult a professional veterinarian immediately and submit water samples for testing." Also provide information on local laboratories or testing services.
记录表/行动清单
It is recommended to provide end users with a simple log sheet (which can be generated automatically by the App):
| Date | Time | Temperature (°C) | EC (µS/cm) | TDS (ppm) | User action | Fish status | Remarks |
|---|---|---|---|---|---|---|---|
| Example | 08:00 | 25.0 | 420 | 210 | Water change 20% | Normal | — |
Action checklist:
- Measure and record at a fixed time each day.
- If EC exceeds the personal baseline by ±20% for two consecutive days, check for evaporation, insufficient water changes, or additives.
- Clean the probe weekly and calibrate once with standard solution (or per the manual).
- If any fish shows abnormality, test immediately and consider sending a sample to a laboratory.
- After a new tank setup or large water change, monitor continuously for one week and observe the trend.
Integration Recommendations for Engineers
For OEM/ODM integration of smart fish tanks, AtomBit provides conductivity/TDS interface ASICs and matching probes, which can simplify analog front-end design. Key considerations:
- Temperature compensation: A high-precision temperature sensor must be integrated, with an appropriate compensation algorithm. It is recommended to verify with two-point calibration at the factory (e.g., 25°C and 30°C).
- Probe material and lifespan: Aquarium water contains organics, algae, and salts, so electrodes are prone to fouling. Choose graphite or platinum-black electrodes and design a self-cleaning reminder.
- Threshold algorithm: Use moving averages and rate-of-change detection to avoid false alarms from single-point spikes. The baseline can be adjusted in conjunction with user operation logs (e.g., water changes, additions).
- User interface: Use colors to distinguish "normal fluctuation," "attention advised," and "inspection needed," and explain possible causes to avoid causing alarm.
- Mass-production validation: Conduct long-term testing in a simulated aquarium environment (with fish, filtration, and daily feeding) and compile statistics on the normal fluctuation range, then set factory thresholds accordingly.
FAQ
Q1: What is the relationship between TDS and conductivity? A: TDS is total dissolved solids, and EC is electrical conductivity. The two are broadly correlated, TDS ≈ EC × coefficient (0.5-0.7), but the coefficient depends on the ion species. The TDS displayed by the device is usually converted from EC and is intended for trend comparison.
Q2: What conductivity is suitable for a fish tank? A: This varies greatly by fish species and water source; for example, freshwater fish tanks commonly have an EC of 200-800 µS/cm, but the local tap water EC and aquaculture recommendations should also be referenced. It is advisable to record your own baseline and watch for deviations.
Q3: Why does the EC measured by the device differ from the laboratory? A: The laboratory may use a different method or calibration standard, and sampling time, temperature compensation and probe condition all affect the reading. Trend changes should be the main reference rather than small differences in absolute values.
Q4: Is temperature compensation important? A: Very important. Without compensation, temperature fluctuations cause significant changes in EC readings. Before measurement, ensure the water sample temperature is close to room temperature or let the sensor compensate automatically.
Q5: Can the device detect ammonia nitrogen or nitrite? A: No. This device (Water Detective 4) measures TOC, COD, UV254, TDS, EC, turbidity, hardness, salinity and temperature; it does not include specific ions such as ammonia nitrogen, nitrite or nitrate. If these data are needed, professional laboratory methods must be used.
References
- World Health Organization. Guidelines for drinking-water quality: fourth edition incorporating the first addendum. Geneva: WHO; 2017. (On the definitions of TDS and conductivity and their health significance, Table A3.2)
- U.S. Geological Survey. Electrical Conductivity and Total Dissolved Solids. USGS Water Science School. https://www.usgs.gov/special-topics/water-science-school/science/electrical-conductivity-and-total-dissolved-solids
- U.S. Environmental Protection Agency. Indicators: Conductivity. National Aquatic Resource Surveys. https://www.epa.gov/national-aquatic-resource-surveys/indicators-conductivity
- ISO 7888:1985. Water quality — Determination of electrical conductivity. International Organization for Standardization.
Regional applicability note: The general water quality parameter definitions above apply worldwide, but specific suitable ranges for fish tanks and regulatory limits vary by region, fish species and water source. For fish disease diagnosis, medication use or aquaculture compliance, please consult a local veterinarian or aquaculture authority. This article does not constitute aquaculture advice.